
The 7 tools for quality (Q7, QM tools)
The purpose of the 7 quality tools
Errors and data can be collected, reasons for errors can be determined and investigated and errors can be prevented and improvements can be made sure by the 7 quality tools. These so-called 7 quality tools were originally put together by Ishikawa for use in quality circles.
The 7 quality tools are simple and efficient tools which will lead to a high degree of efficacy if they are used precisely.
An overview of the 7 quality tools
A short description of the 7 quality tools comes next.
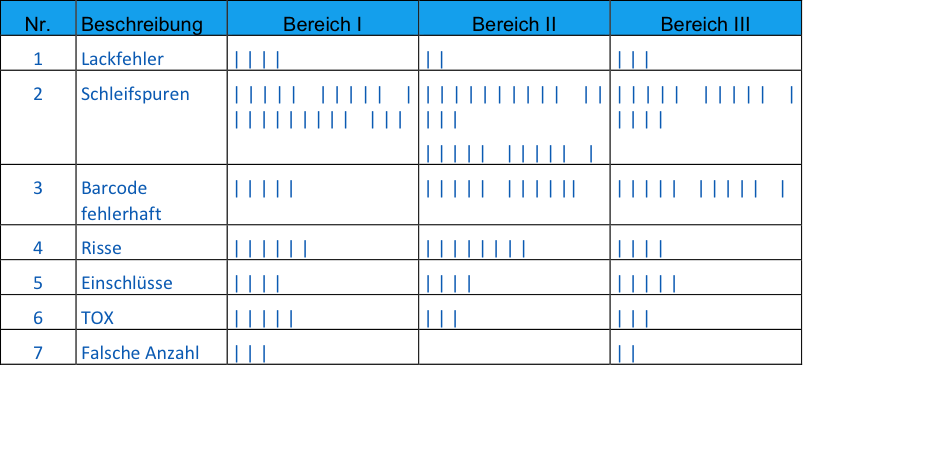
Error collection list (also referred to as data collection sheet)
The easiest variety of this consists of a piece of paper with handwritten records on the systematic detection and depiction of different main errors.
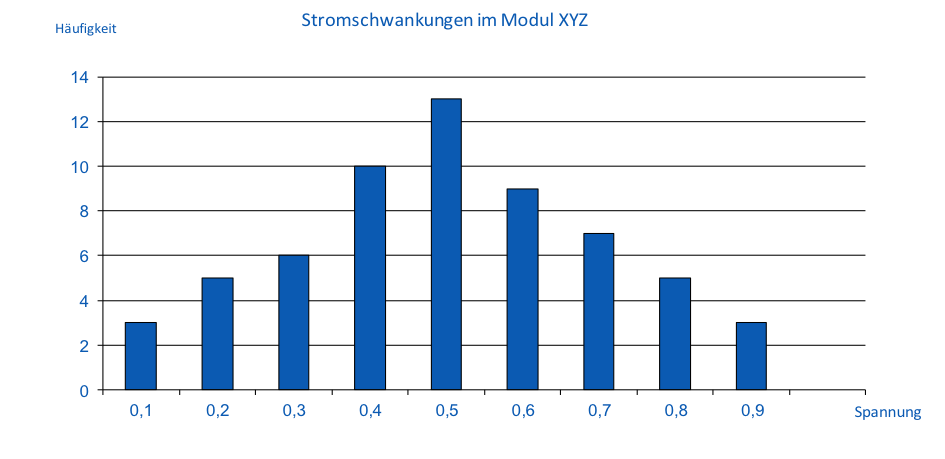
Histogram
Data are put in order depending on the respective frequency of e.g., their occurrence over time. A histogram (a bar chart) is the graphical depiction of the frequency distribution of a quantity of data which were summarized. The depiction helps to classify individual results among a group of the same result or to determine the area where an individual result is expected. Mean values and distributions constitute important extensions of such histograms. The histogram is the basis of further methods like a superimposed bell-shaped curve; the normal distribution.
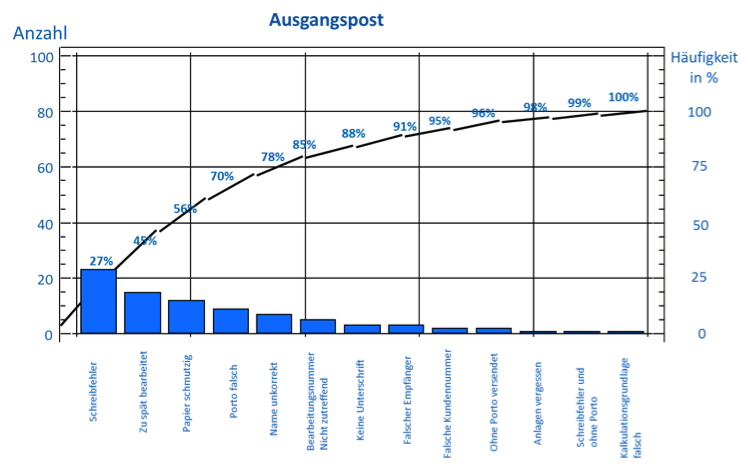
Pareto
The Pareto depiction is another quality tool. It is a vertical bar chart for the graphical depiction of the reasons for problems. Influences can be arranged here depending on their significance. Important occurrences can be separated from irrelevant ones through the Pareto diagram. Other designations for this are 80-20 distribution or ABC analysis. This tool helps to detect the main reasons better and to process them efficiently.
Cause-and-effect diagram, Ishikawa diagram or Fishbone diagram
Reasons for the development of problems can be classified and analyzed through a combination of the 5 Ms (machines, methods, materials, man, mission / Mother Nature) or the 7 Ms (machines, methods, materials, man, mission / Mother Nature, measurements, management). That will clarify if the problems respectively the errors might have several reasons which are frequently interconnected. 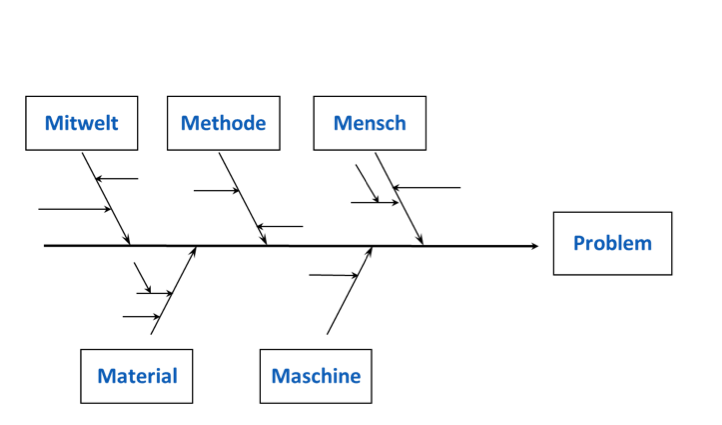
Stratification
This is about separating and stratifying data from different sources. Different data are collected in order for them to be treated based on facts.
This is supposed to identify root causes so that improvement measures can be managed.
In many depictions, the method is referred to as brainstorming instead of stratification. Brainstorming is a basic entrance-level technique for looking for possible reasons for problems together in a group of people.
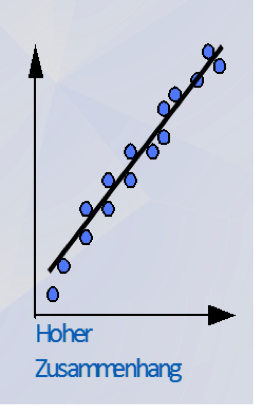
Correlation diagram
This is the graphical depiction of a correlation between two measured values. Correlations, connections, regularities and tendencies can be read off here.
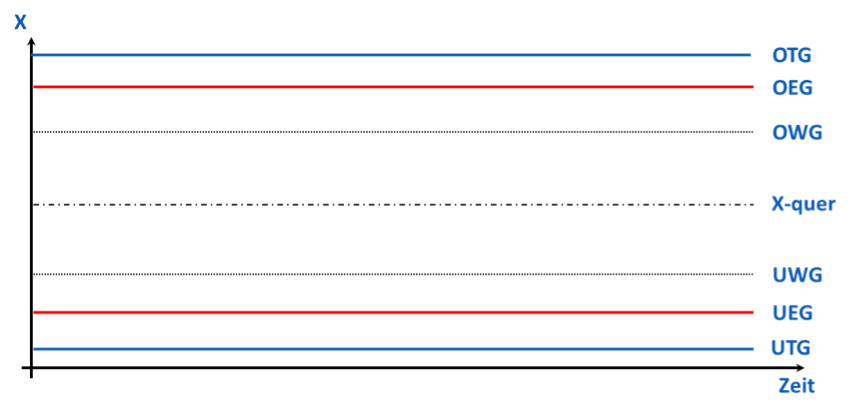
Control chart, quality control chart
This is an easy quality tool in order to check whether, e.g., a process operates within the tolerance limits and to make sure that it does. The results can be depicted graphically with the aid of the control chart. Furthermore, this tool is excellent for explaining and setting out the standard requirements from chapter 8.1 on “controlled conditions”. More information on that will be posted in one of the next publications.
[/et_pb_text][et_pb_code _builder_version=”4.2.2″ vertical_offset_tablet=”0″ horizontal_offset_tablet=”0″ z_index_tablet=”0″]
The 7 Quality Tools (Q7, QM Tools)
What are the 7 Quality Tools (Q7)?
The 7 Quality Tools (abbreviated as Q7, QM Tools) are a collection of proven methods for quality assurance. With them, users can document errors in a strongly targeted manner and collect data, which can be used for avoiding these very mistakes in the future. The methods had already been compiled by Japanese chemist Ishikawa Kaoru in 1943 but they have not lost any of their relevance up to now.
What methods do the 7 Quality Tools include?
The Q7 consist of error collection lists (also data collection sheet), histograms, Pareto charts, Ishikawa diagrams (cause-and-effect diagrams), stratification (colloquially referred to as brainstorming), correlation diagrams and control charts.
What are the M7 (7 Management Tools)?
In contrast to the analytical and quantitative methods of the Q7, the 7 Management Tools (M7) provide a collection of tools which make it possible to structure and analyze verbal information. To present it in a simplified manner, problem solving occurs here through a process of identifying the problem, finding the solution and implementing the solution.
What other QM Tools are there on top of the Q7?
Aside from the classic Q7, FMEA (Failure Mode and Effects Analysis), PPAP (Production Part Approval Process), QFD (Quality Function Deployment) as well as SPC (Statistical Process Control) are utilized most often in practice.